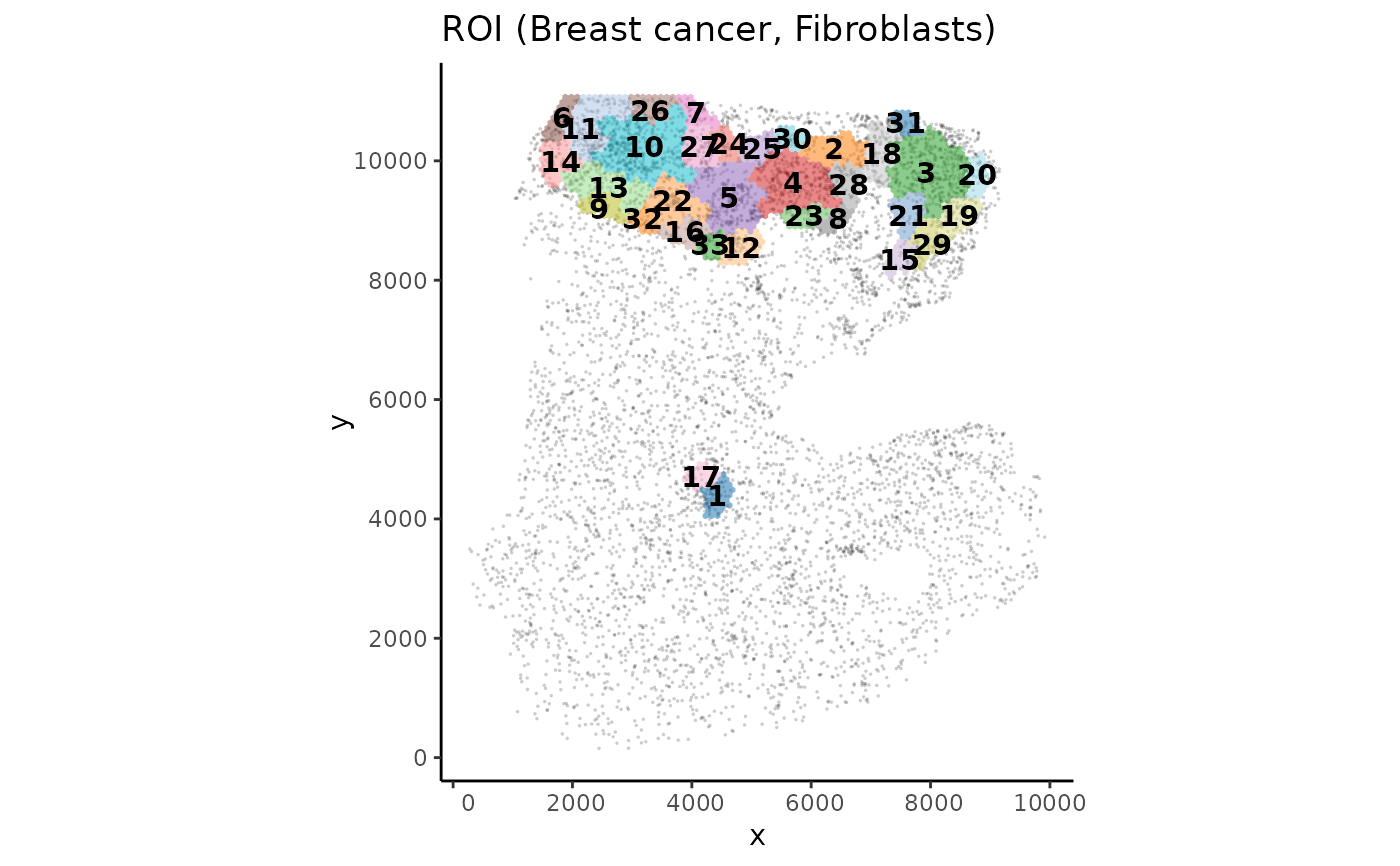
Plot ROIs on spatial.
Usage
plotROI(
  spe,
  roi = NULL,
  id = "cell_type",
  label = TRUE,
  show.legend = FALSE,
  reverseY = NULL,
  ...
)
Arguments
- spe
A SpatialExperiment object.
- roi
Character. The name of the group or cell type on which the roi is computed. All cell types are chosen if NULL or 'overall'.
- id
Character. The name of the column of colData(spe) containing the cell type identifiers. Set to cell_type by default.
- label
Logical. Show ROI label or not.
- show.legend
Logical. Show legend or not.
- reverseY
Logical. Whether to reverse Y coordinates. Default is TRUE if the spe contains an image (even if not plotted) and FALSE if otherwise.
- ...
Parameters pass to plotSpatial
Examples
data("xenium_bc_spe")

coi <- c("Breast cancer", "Fibroblasts")

spe <- gridDensity(spe, coi = coi)

spe <- findROI(spe, coi = coi, method = "walktrap", steps = 5)

plotROI(spe, roi = coi, pt.size = 0.3, pt.alpha = 0.2)