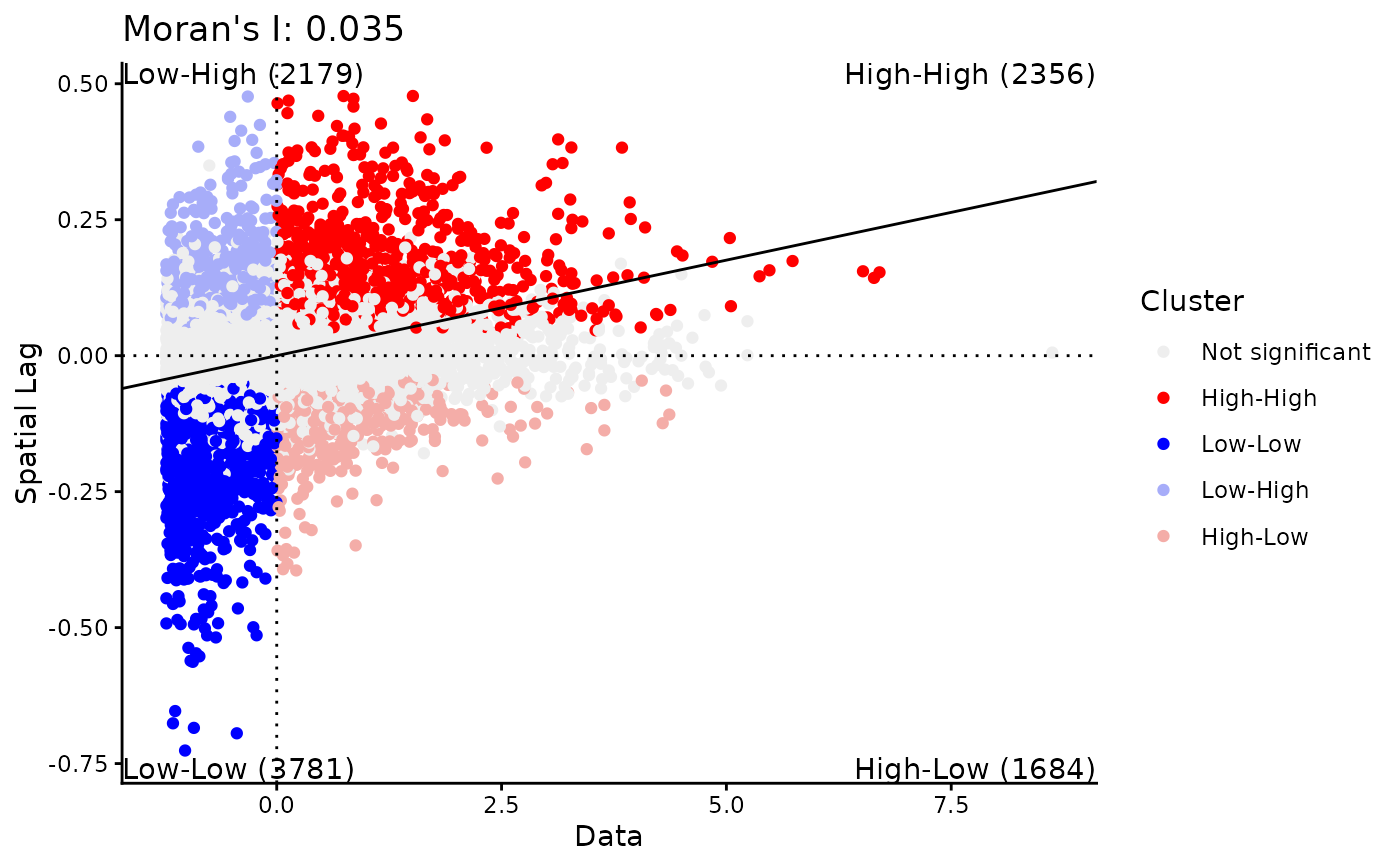
plot result obtained from localMoran()
Usage
plotLISAscatter(
  lisa,
  quadrant.count = TRUE,
  text.size = 11/.pt,
  xlab = "Data",
  ylab = "Spatial Lag"
)
Arguments
- lisa
A list obtained from localMoran
- quadrant.count
Whether to count values at each quadrant (Low-Low, Low-High, High-High, High-Low)
- text.size
Numeric for text size of quadrant.count
- xlab
label for the x-axis
- ylab
label for the y-axis
Examples
data("xenium_bc_spe")
dat <- spe$total_counts
spe <- findNbrsSpatial(spe,k=50)
res <- localMoran(spe,data1=dat,at="cell")
plotLISAscatter(res)