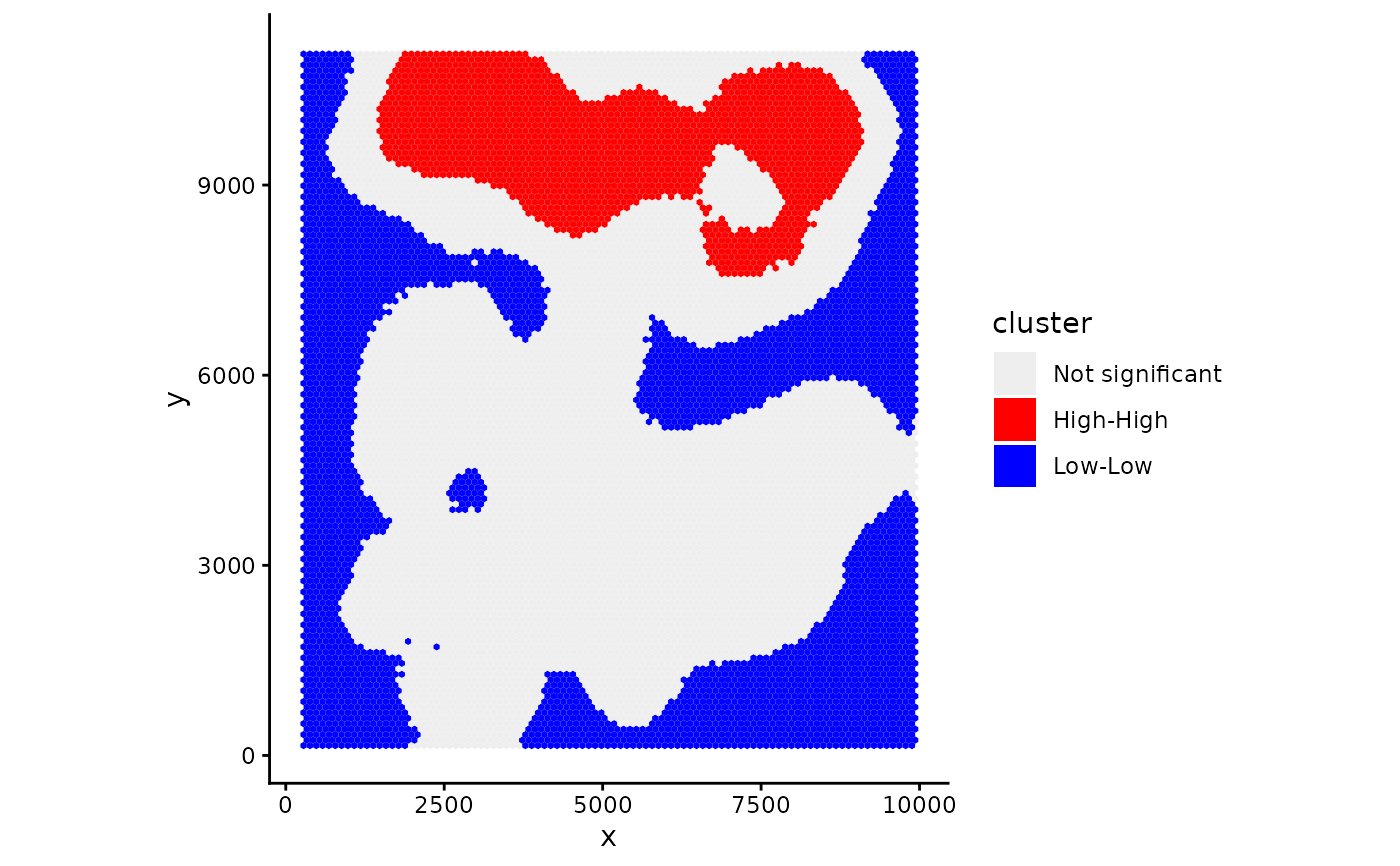
Plotting LISA (e.g. moran)
Arguments
- spe
A SpatialExperiment object.
- lisa
Output from localMoran
- overlay
Option of grid or point. Depend on whether localMoran is calculated at grid or point.
- type
Option of cluster or logpvalue for plotting lisa's cluster or p-value, respectively.
- reverseY
Logical. Whether to reverse Y coordinates. Default is TRUE if the spe contains an image (even if not plotted) and FALSE if otherwise.
- ...
Parameters pass to plotGrid or plotSpatial, depending on overlay.
Examples
data("xenium_bc_spe")
spe <- gridDensity(spe, coi = "Breast cancer")
dat <- spe@metadata$grid_density$density_breast_cancer
spe <- findNbrsGrid(spe)
res <- localMoran(spe,data1=dat, at = "grid")
plotLISA(spe,lisa = res)