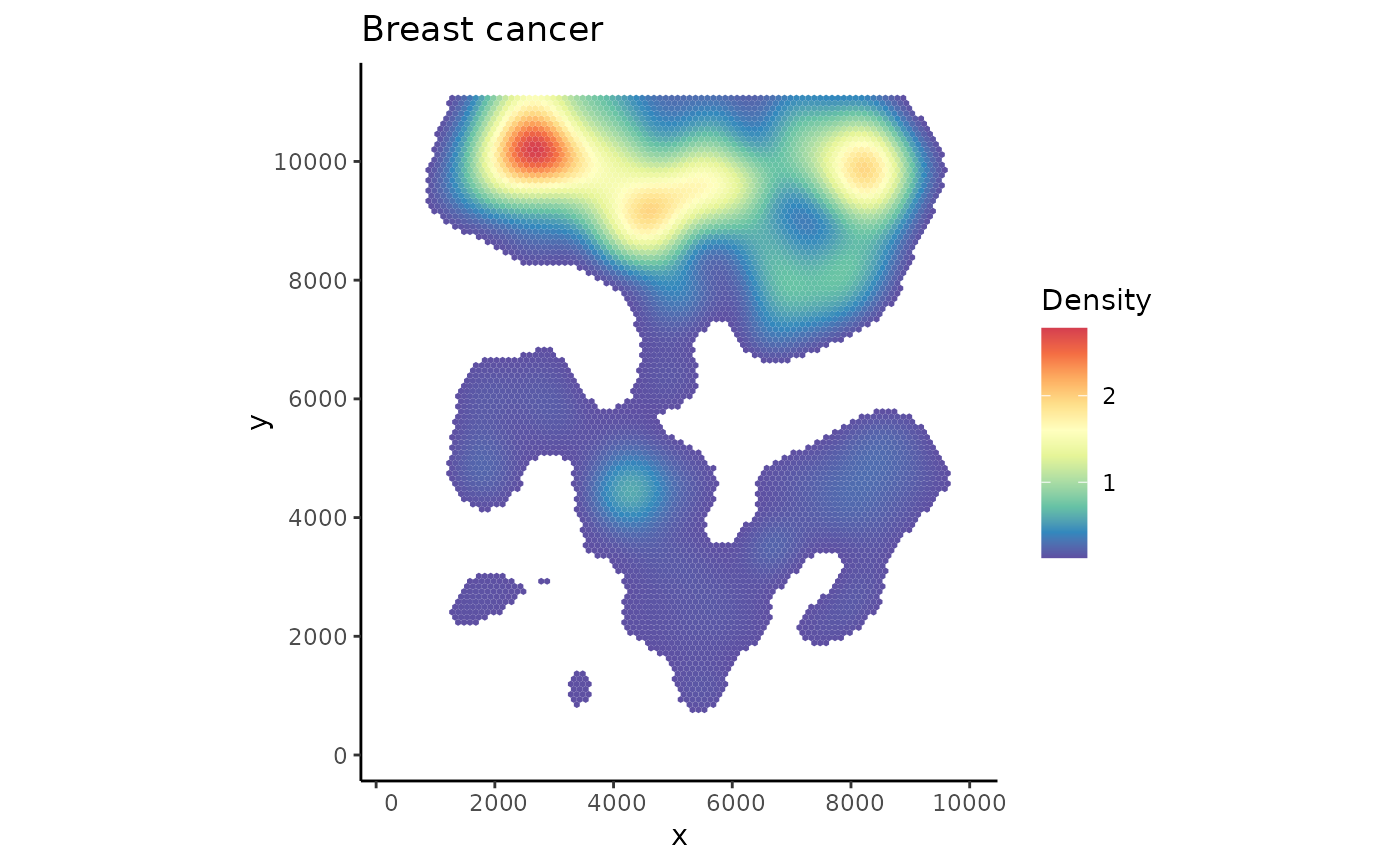
Plot grid-based density.
Arguments
- spe
A SpatialExperiment object.
- coi
A character vector of cell types of interest (COIs) to be plotted. Default to all cell types.
- probs
Numeric value between 0 and 1, used for filtering uninformative grid, default is 0.5.
- reverseY
Logical. Whether to reverse Y coordinates. Default is TRUE if the spe contains an image (even if not plotted) and FALSE if otherwise.
- ...
Parameters pass to plotGrid
Examples
data("xenium_bc_spe")

spe <- gridDensity(spe)

plotDensity(spe, coi = "Breast cancer")


plotDensity(spe, coi = "Fibroblasts")
