Plot contour lines.
Usage
plotContour(
  spe,
  coi = NULL,
  overlay = c("cell", "density", "none"),
  id = "cell_type",
  sub.level = NULL,
  line.type = 1,
  line.width = 0.5,
  line.alpha = 1,
  reverseY = NULL,
  ...
)
Arguments
- spe
A SpatialExperiment object.
- coi
A character vector of cell types of interest (COIs). All cell types are chosen if NULL or 'overall'.
- overlay
Character vector. Options are 'cell' (plot overlay on cells), 'density' (overlay on density), or 'none'. Default to 'cell'.
- id
A character. The name of the column of colData(spe) containing the cell type identifiers. Set to 'cell_type' by default.
- sub.level
Character vector. Subset on specific level.
- line.type
shape of contour. See 'ggplot2::geom_path()'.
- line.width
size of contour.
- line.alpha
alpha of contour between 0 and 1.
- reverseY
Logical. Whether to reverse Y coordinates. Default is TRUE if the spe contains an image (even if not plotted) and FALSE if otherwise.
- ...
Aesthetic mappings to pass to plotSpatial, plotDensity, or plotImage, depending on the overlay.
Examples
data("xenium_bc_spe")
spe <- gridDensity(spe)
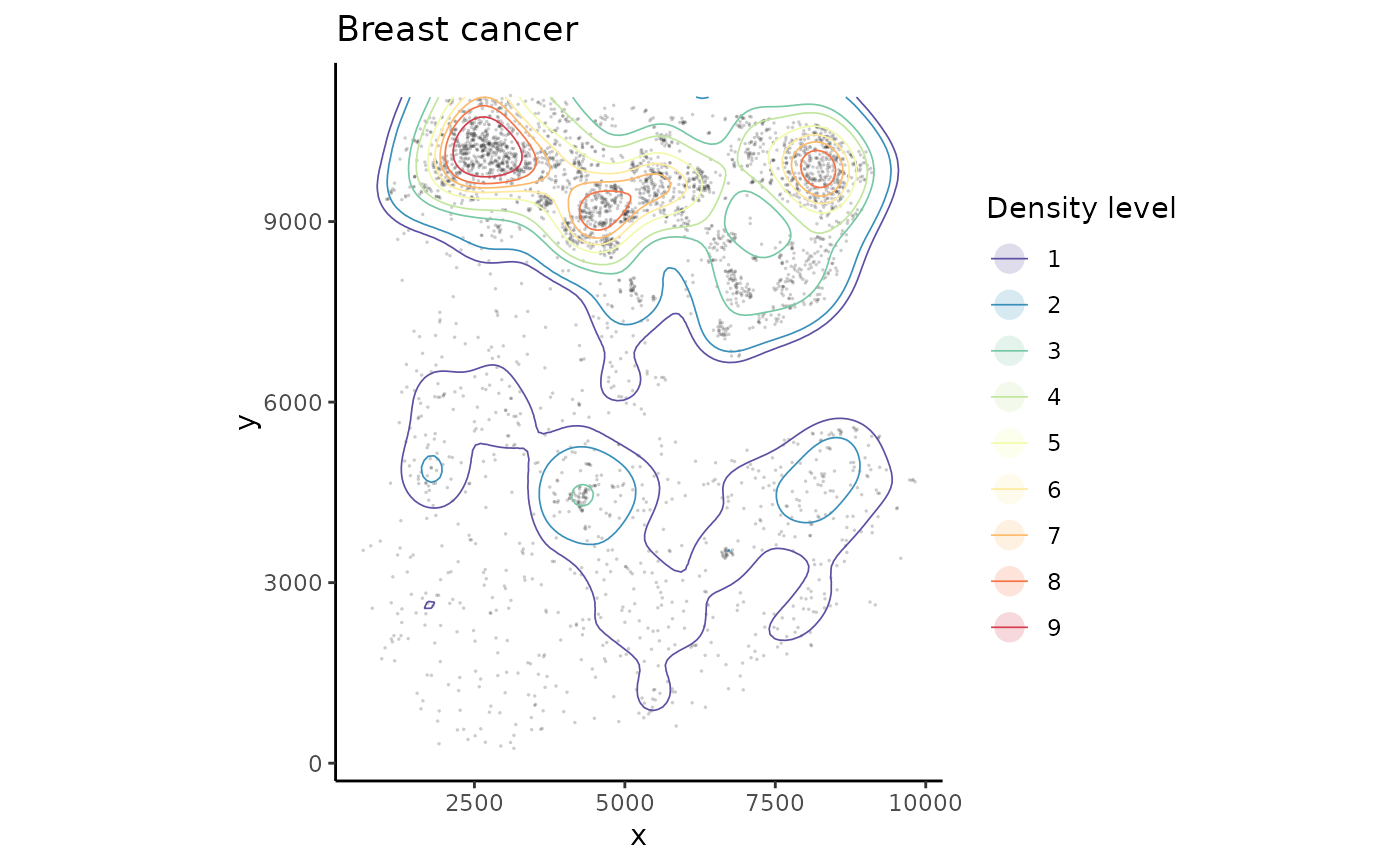
coi <- "Breast cancer"
spe <- getContour(spe, coi = coi)
#> Using bins = 10 to draw contours with equal cell numbers.
plotContour(spe, coi = coi, line.width = 0.3, pt.alpha = 0.2)