Plot cell type composition in each density level of cell of interest.
Source:R/plotCellCompo.R
plotCellCompo.RdPlot cell type composition in each density level of cell of interest.
Arguments
- spe
A SpatialExperiment object.
- contour
A character vector of cell type(s) on which the contour density level is calculated. If NULL, it looks for 'overall_contour' in colData(spe). Default to NULL.
- id
A character. The name of the column of colData(spe) containing the cell type identifiers. Set to 'cell_type' by default.
- roi
Character. The name of the group or cell type on which the roi is computed. Default is NULL for no plotting by ROI
- self.included
Logical. Whether to include all the cell types in the plot. Default to TRUE. If FALSE, the cell types specified in 'contour' will not be included in the plot.
Examples
data("xenium_bc_spe")
coi <- "Breast cancer"
spe <- gridDensity(spe, coi = coi)
spe <- findROI(spe, coi = coi)
spe <- getContour(spe, coi = coi)
#> Using bins = 10 to draw contours with equal cell numbers.
spe <- allocateCells(spe, contour = coi)
#> Assigning cells to ROIs defined by Breast cancer
#> Assigning cells to contour levels of Breast cancer
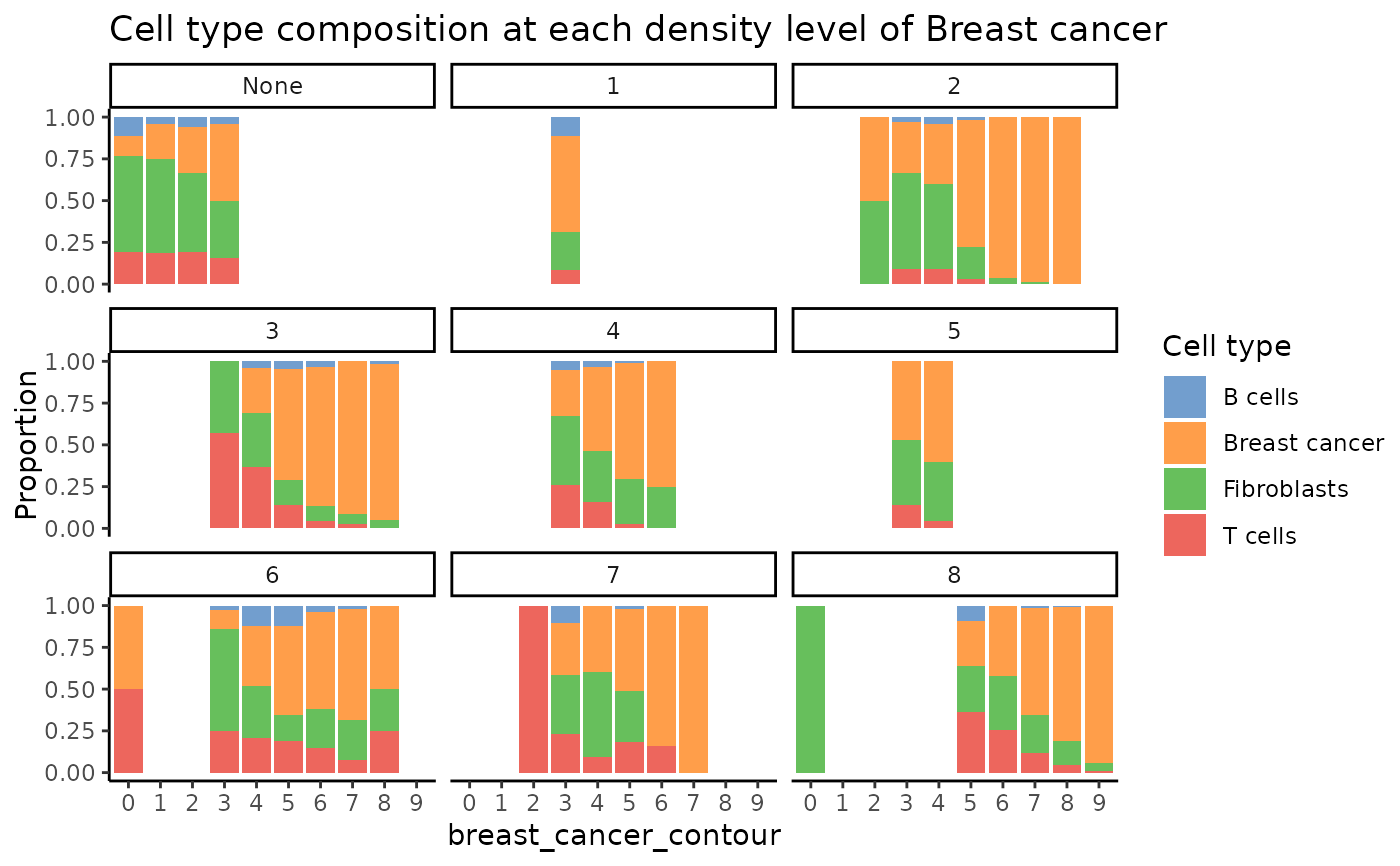
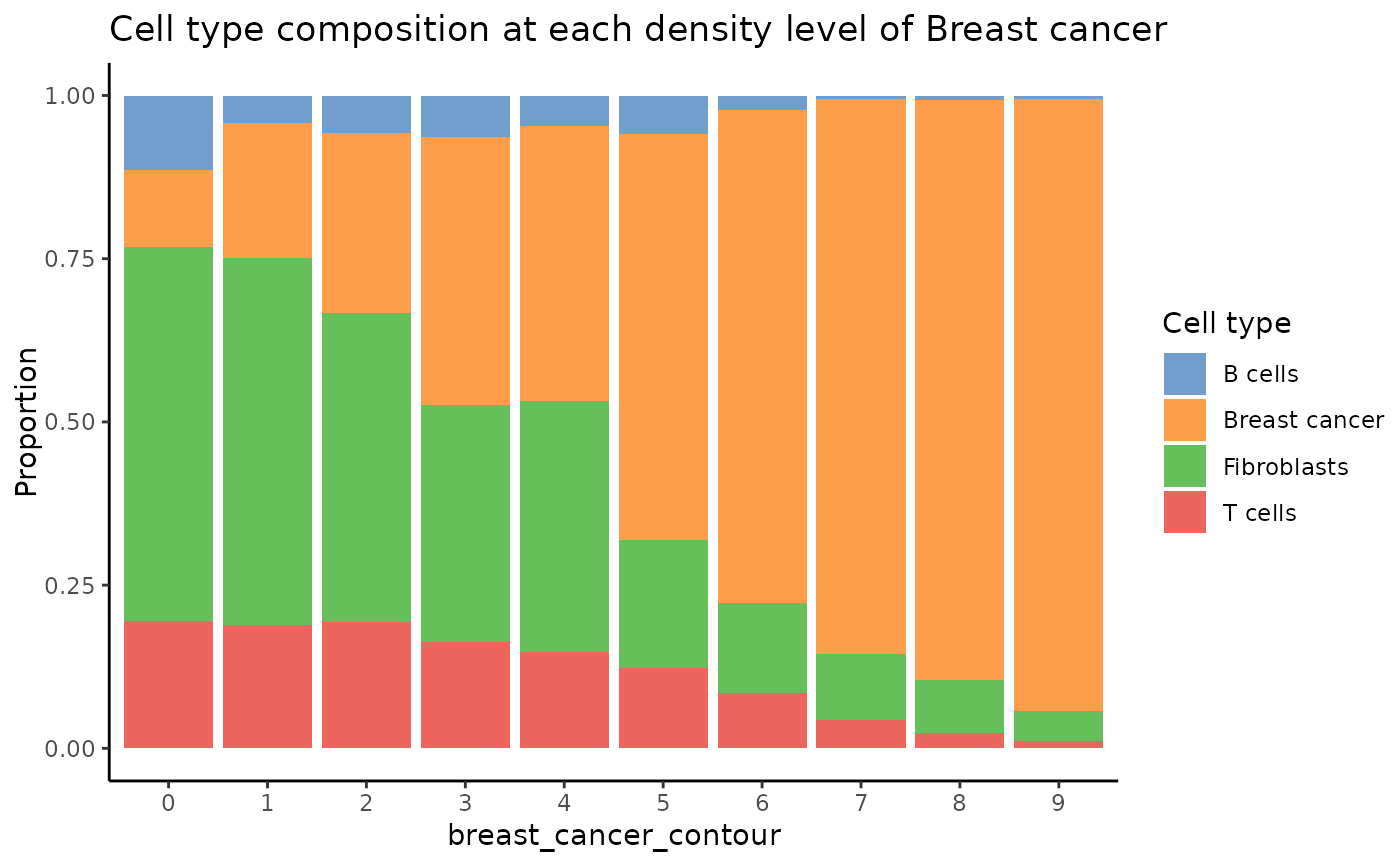
plotCellCompo(spe, contour = "Breast cancer")
 plotCellCompo(spe, contour = "Breast cancer", roi = coi)